Aquaculture Farm Management at Your Fingertips
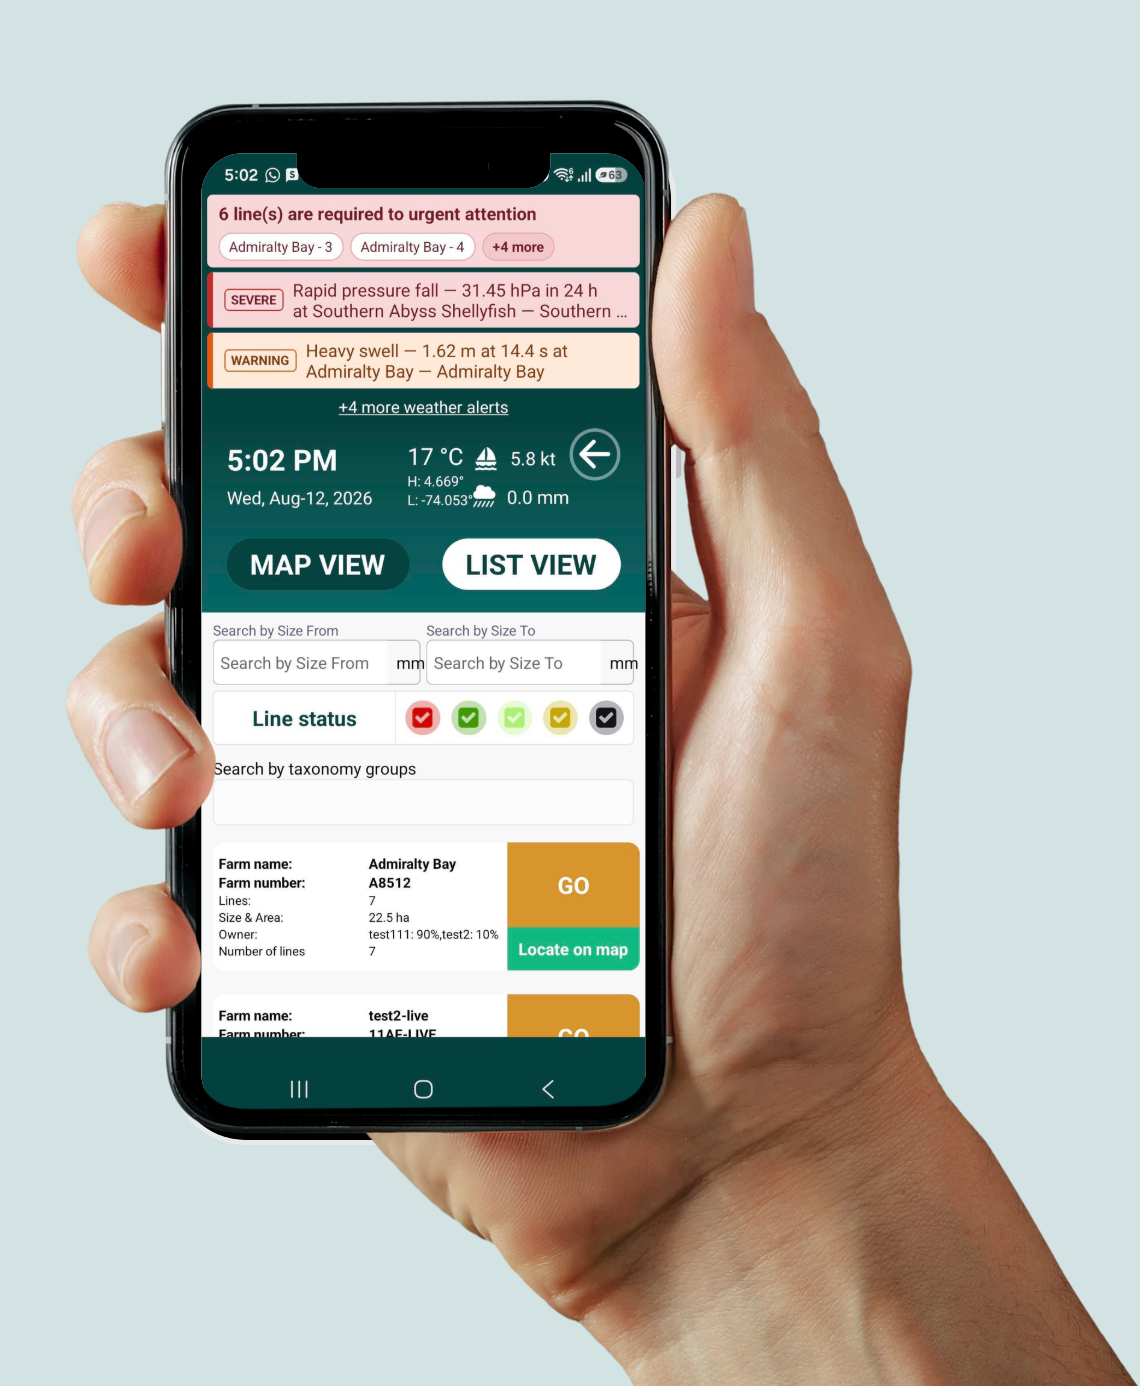
The Skipper App runs your day from the boat: farms, lines, tasks, seedings and harvests, with meters tracked on screen so crews can check progress without switching views. Automatic Photo Assessment reads mussel size from the plate. Voice commands for notes. Full offline mode with pending-sync notifications, so you always know what’s still waiting to upload.

Inventory Tracking
Maintain an impeccable record of your equipment with our tracking features. From long lines to cages and floats, track everything. You can also visualise submerged equipment and GPS track it*. This clarity not only bolsters farm operations and reduces the risk of losses but also enhances your credibility with financial and insurance entities.
Complete Lifecycle Monitoring
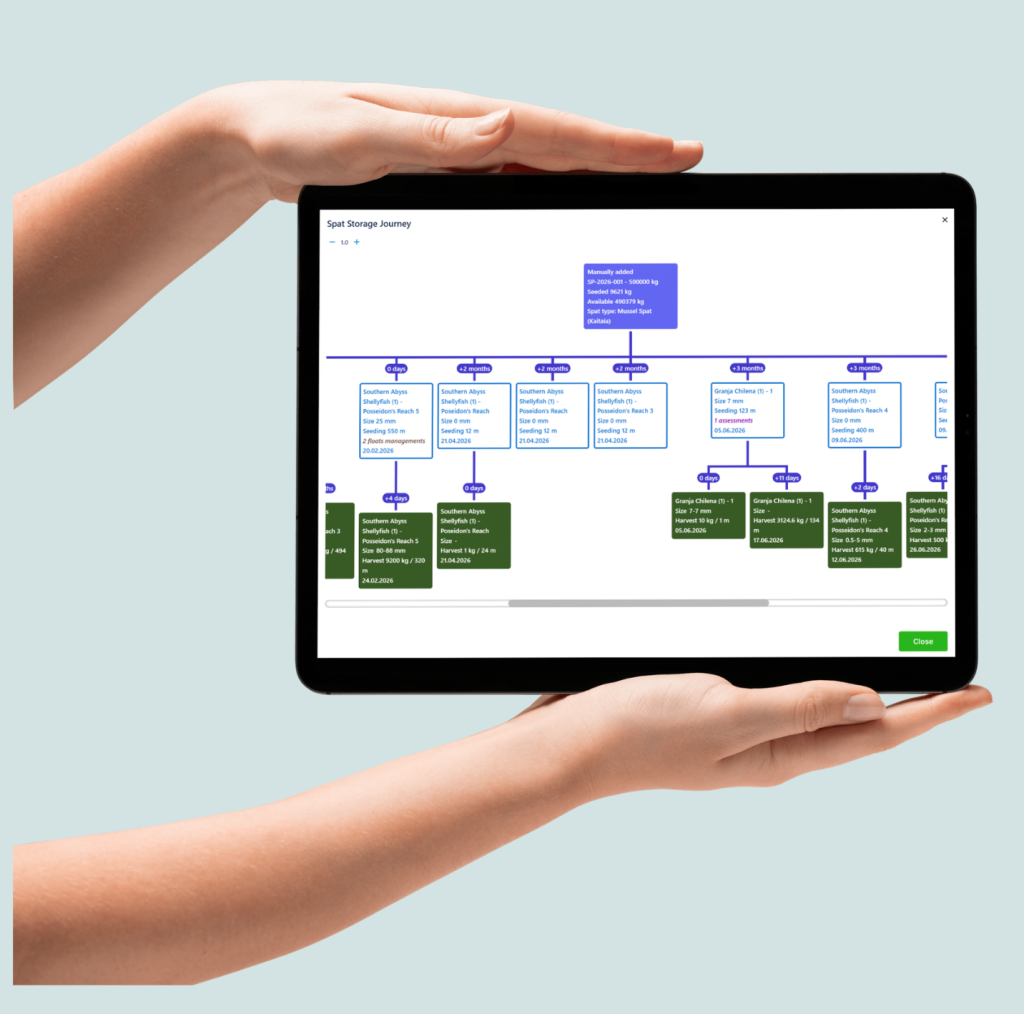
Every seeding, assessment, maintenance record and harvest stays linked. Completed seedings stay visible with a strikethrough instead of disappearing. Delete warnings list everything attached before you remove anything. Archive inactive farms and lines without losing their history.
Reports built your way
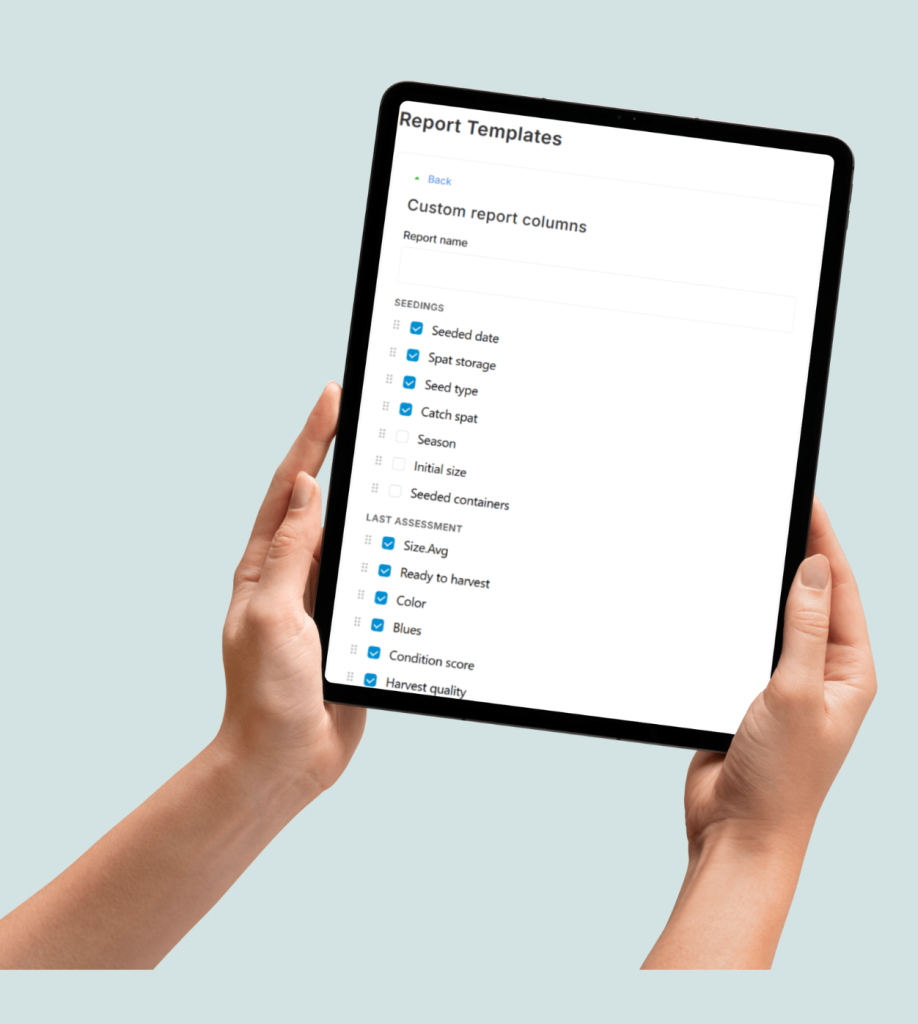
Create your own templates: keep the columns you need, drop the ones you don’t, save the layout (online, PDF or Excel). Schedule reports to arrive by email, download a full backup of your data any time, and use automations for the logs that repeat every week. A single click now replaces hours of manual data compilation, simplifying insurance and regulatory compliance.
Processing and profitability
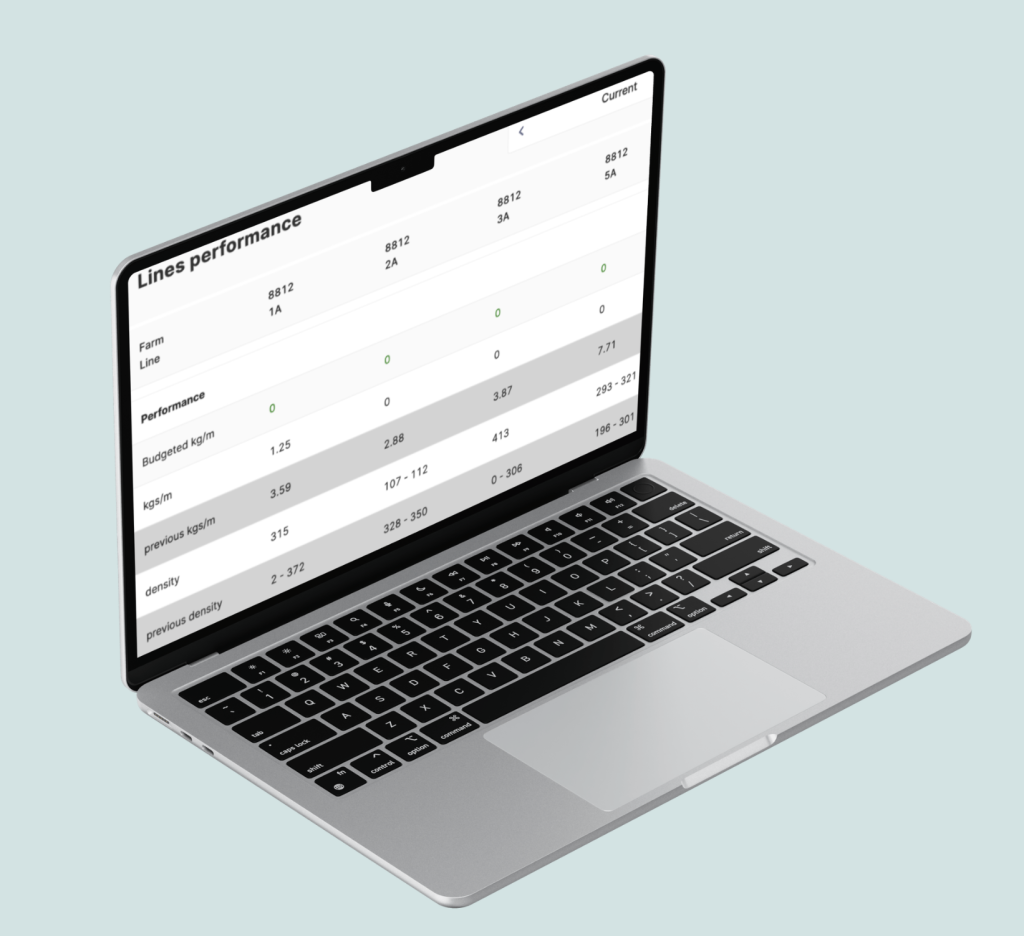
See what came off the water and what was left after processing, tracked separately. Price per processed kg or dozen, with effective dates and price history. Reports now include performance and financial detail, plus a total of empty versus full lines.
AI that works on your farm’s data
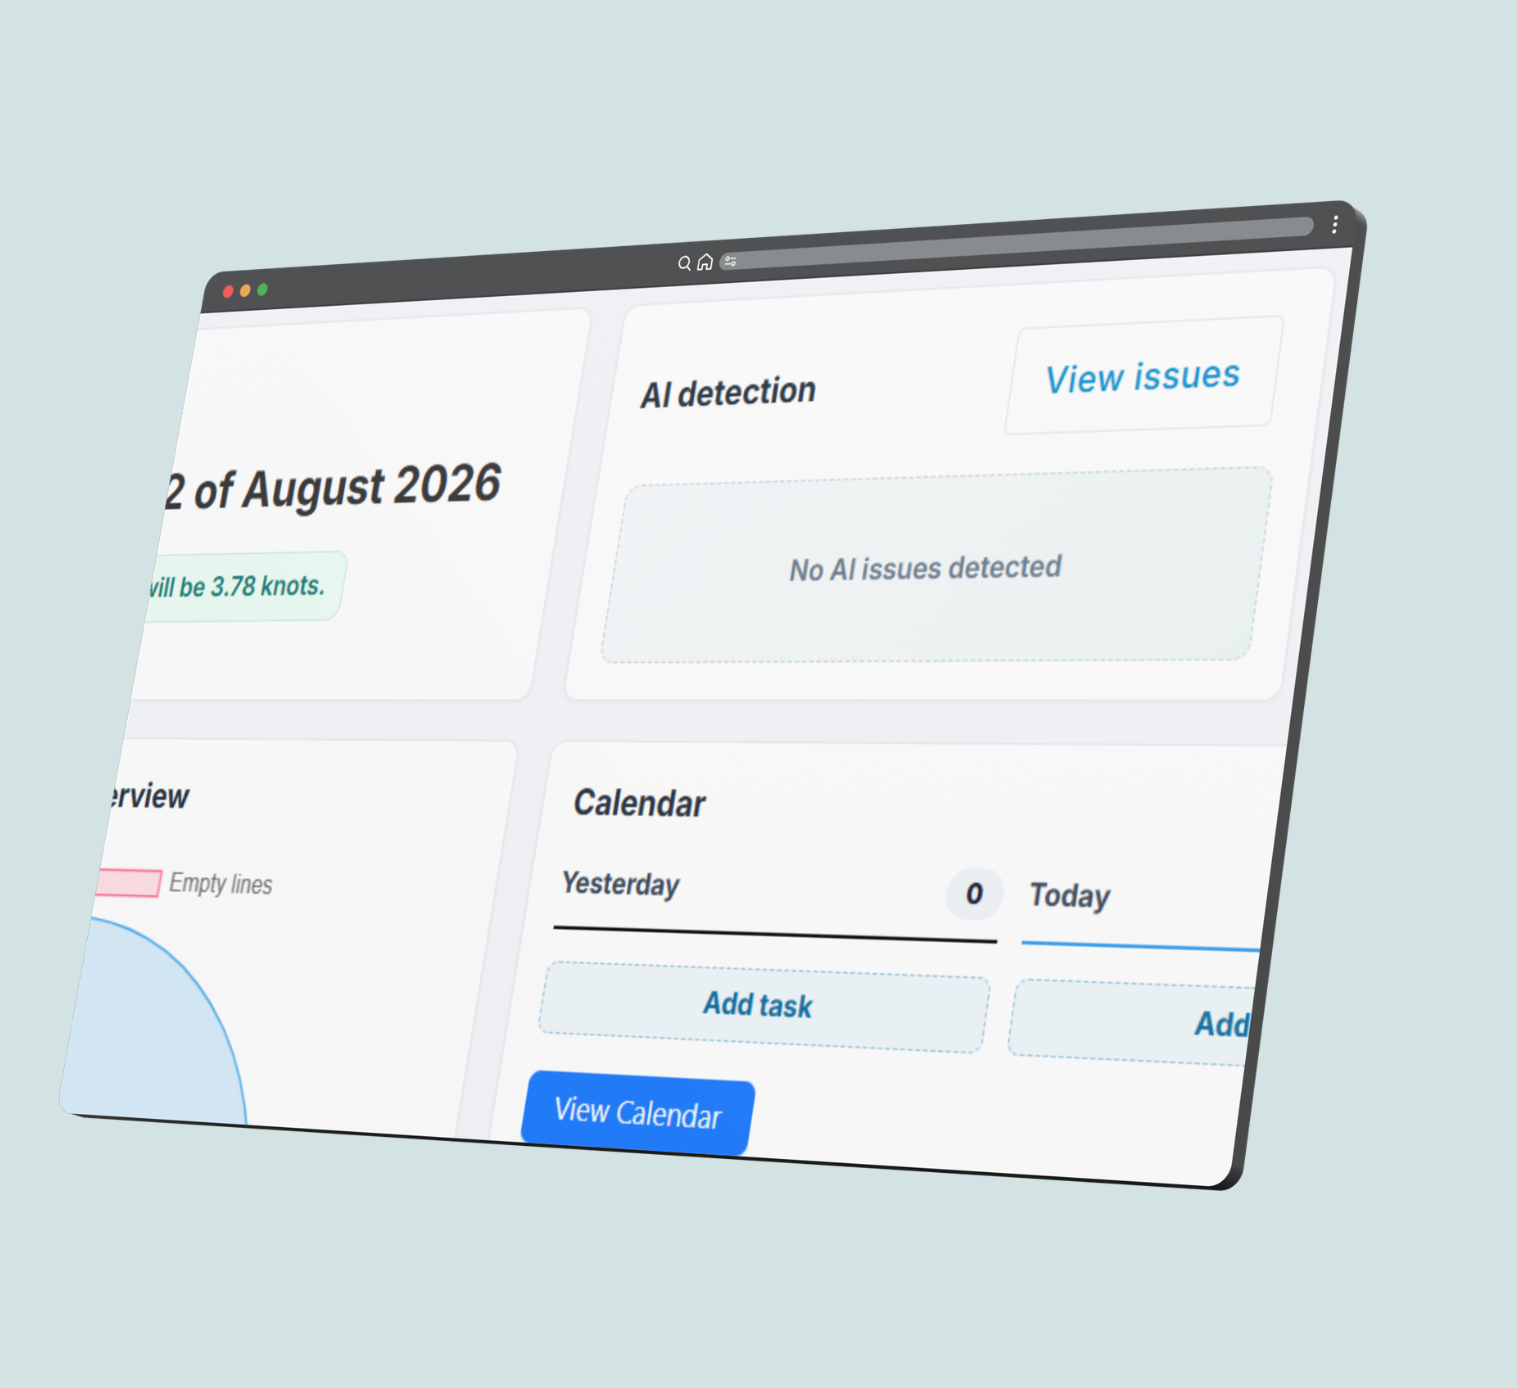
AI Quality Detection: flags quality issues automatically, catching things a manual check can miss.
Automatic Photo Assessment: point the camera at the plate in the Skipper App and it reads the size. No measuring by eye, no typing. Manual entry still there if you want it.
Ask it directly: connect MusselApp to ChatGPT or Claude and ask: what’s on Line 12 right now? Or dictate today’s assessment and have it recorded. It confirms before saving, and every entry passes the same checks as the app.
Data quality flags: with AI, what goes in is what comes out. A dedicated page scans your records for anything inconsistent (an assessment dated before its seeding, a final harvest with no amount) so the analytics aren’t learning from bad data.
Centralized Task Management
Coordinate your team effortlessly with our centralised control panel. Farm and line shown on every task in the calendar. Timesheets searchable by farm number, line, vessel or client, filterable by vessel, with comment templates and batch numbers. It remembers your last selection so you’re not re-picking the same activity all day. Boat reference on every action, so you know which vessel did what.


Environmental Monitoring
Our system automatically integrates weather data with the lifecycle of your mussels, oysters, or seaweed. By connecting to sensors or importing data directly from your sensors (subject to ability to download data), we enhance forecasting capabilities and report on best practices for yield improvement, including biofouling control.
Harvest and reseeding forecasts
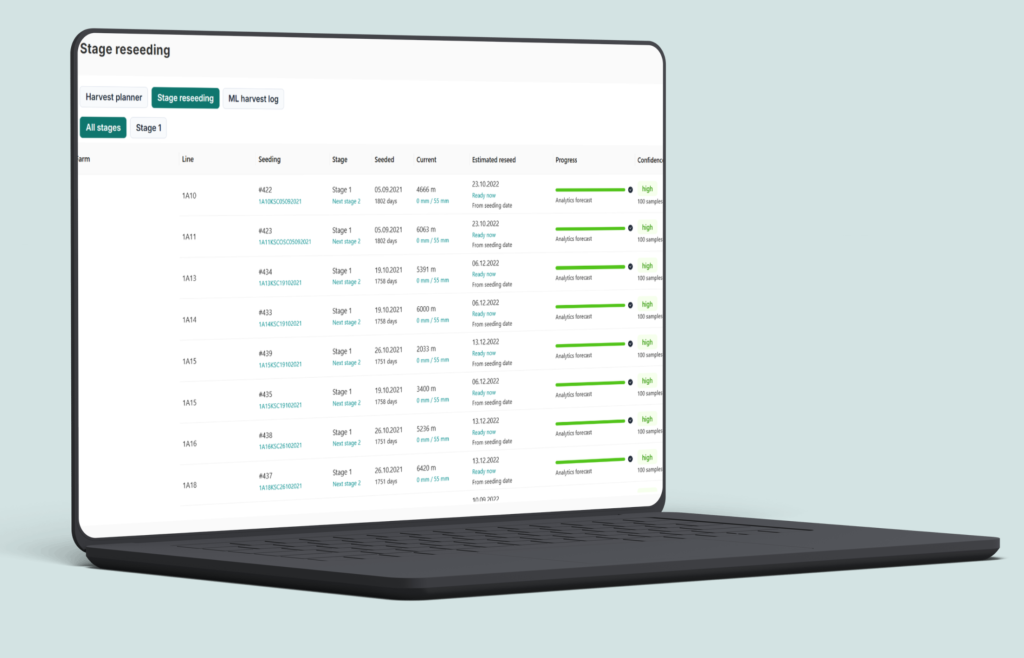
Harvest date, weight, expected quality and reseeding schedules, forecast from your own records. Mussels and oysters modelled separately, because they don’t grow the same. Stage Reseeding shows which lines are ready to move up with a confidence score that climbs as your history grows. When a forecast misses by two weeks or more it’s logged in the ML Harvest Log and used to improve the next one.
Spat Weather Analytics

One catch worth knowing: we can’t go back in time to collect weather. It starts the day you join.
Two years in the making, and as far as we know the first tool that runs this kind of analysis on a single farm’s own records, not industry averages.
It reads your seedings, assessments and harvests, cross-references the weather your farm was actually exposed to during those periods, and surfaces the patterns already sitting in your history: which spat sources grew fastest, which weather conditions lined up with better or worse outcomes, which management decisions correlate with stronger performance, and what your best farms are doing differently.
Scores are adjusted for farm, line, season and weather, so you’re comparing spat on equal terms and every insight tells you how many samples it’s based on, so you know the difference between a lucky one-off and a real signal. Available for mussels, oysters and seaweed.
Coming soon: farm-specific weather warnings
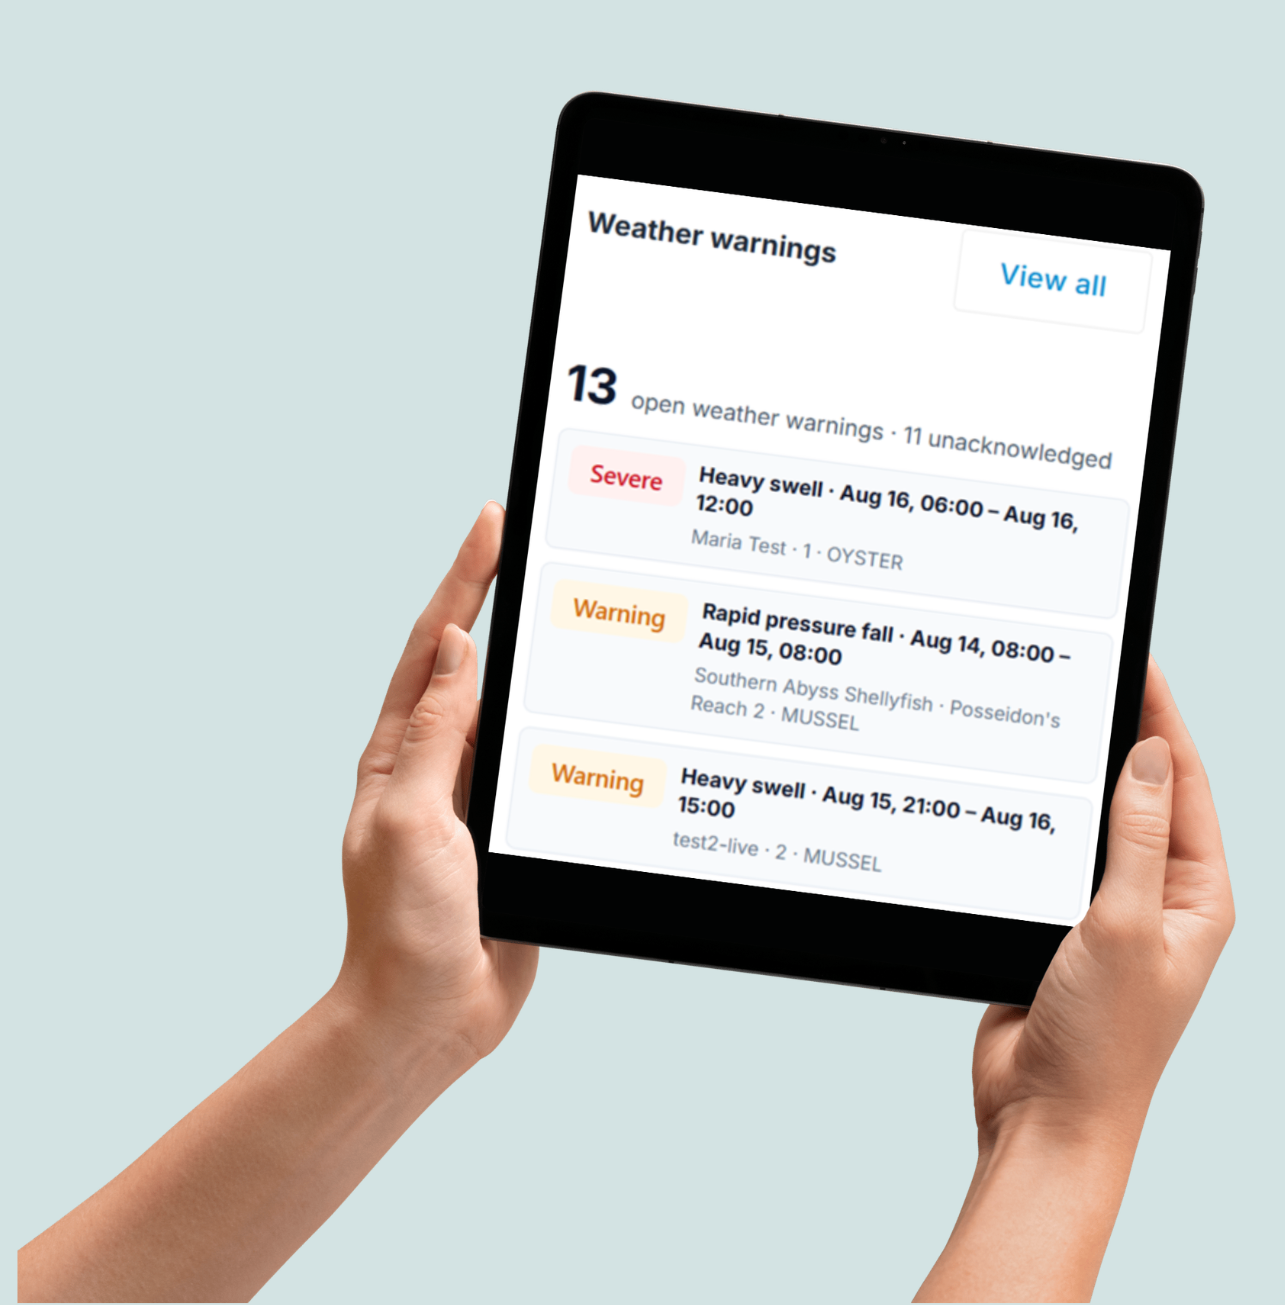
Not another forecast. Instead of “gusts to 38 knots Saturday,” you’ll get: gale conditions from 3am to 2pm on Farm 12, against the 34-knot limit you set, secure loose gear Friday. It’ll also tell you which days are workable, a system that only brings bad news gets muted, and then the warning that matters never arrives.
In testing against real farms and real operating limits before it reaches anyone’s account.